Abstract
A neurology workforce survey was conducted by the Association of British Neurologists and compared with the annual Royal College of Physicians census in November 2018-March 2019. 46% of consultants and 35% of trainees responded. Based on the clinical work contracted (excluding academic and other work), the calculated number of consultant neurologists was 1 per 91,175 of the population. There is significant geographical variation in the number of consultants throughout the UK. There is a gradual shift when comparing the trainee and consultant data towards better gender and ethnic representation in the former. The data highlights potential future workforce planning issues including the potential impact of the increasing number of female trainees.
Introduction
Determining current neurology workforce is key to planning future care of patients with neurological conditions in the UK. The Royal College of Physicians (RCP London, Edinburgh and Glasgow) run an annual census with the help of the Medical Workforce Unit. The Association of British Neurologists (ABN) wanted to triangulate the figures obtained by conducting an independent survey during 2018-2019. The secondary aim was also to obtain more subspecialty specific information.
Methods
A link to an electronic survey was sent out to all ABN members on November 30th 2018 with reminders sent out until close of survey in March 2019. Non-members were also encouraged to complete it. The data from this was compared to the RCP survey published in October 20191. Any duplicates were removed from the dataset. It was assumed that the sample was representative and therefore the results were extrapolated.
Results
Response rate
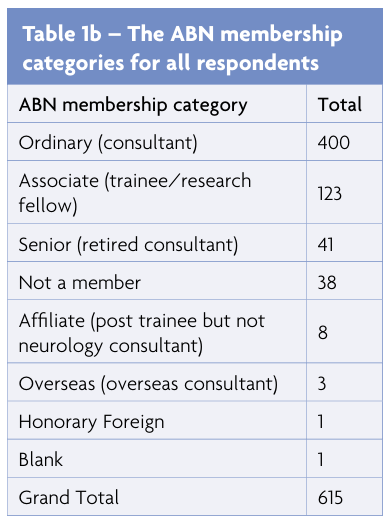
There were 615 respondents in the ABN survey (Tables 1a, 1b). Of these, 400 were ordinary members and 445 stated their role as consultant neurologist (Tables 1a, 1b). The RCP survey determined the total number of consultant neurologists in the country as 958. This is a robust figure derived using data from the General Medical Council (GMC), as well as contacting each trust to determine the number at an individual trust level and incorporating data from new consultant appointments compiled by the RCP during the year. Using 958 as the total number of consultant neurologists, the respondent rate for the RCP survey was 31%. For the ABN survey, the respondent rate was 46% (445/958).
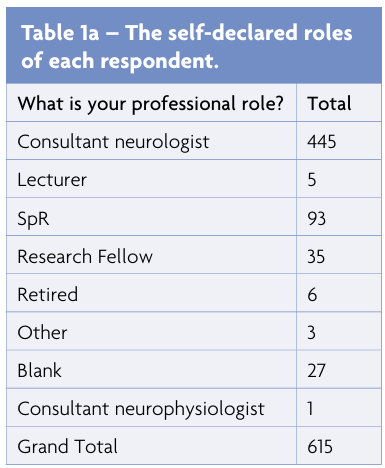
123 associate members responded to the survey (Table 1b). It is noted that 93 of respondents determined their role as specialist registrars and 35 as research fellows (Table 1a). The RCP had information from the Joint Royal College of Physicians Training Board (JRCPTB) that determined the total number of neurology trainees as 362. Using this, the respondent rate for the RCP survey was 37%. For the ABN survey, using both registrars and research fellows as a surrogate for trainees, the equivalent respondent rate would be 35%.
The role of the respondent / Membership of the ABN
Table 1a lists the self-declared role of each respondent and 1b summarises the membership category of the ABN held by the respondents.
Consultant Neurologists
This section of the report is based on consultants alone ie those who responded as their role being a consultant neurologist.
Consultant workforce
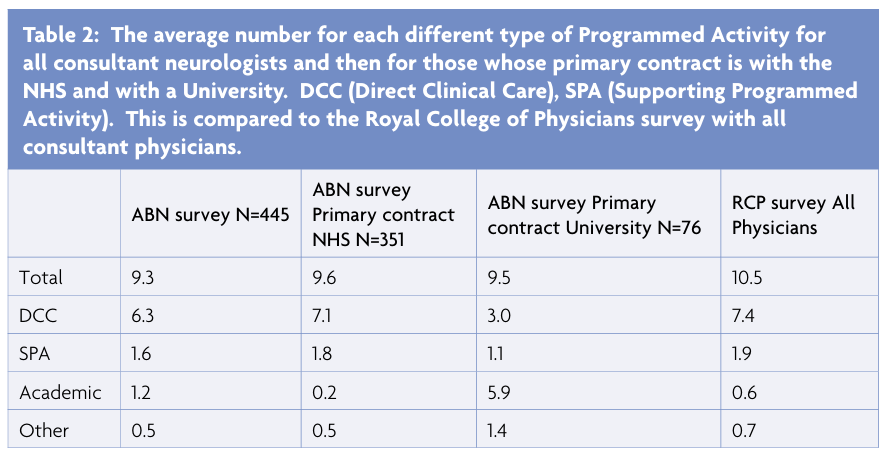
The RCP survey calculated the number of consultant neurology Full time equivalents (FTEs) for the population of 65,737,181 as 873 ie 1 per 75,292. The total number of Direct Clinical Care (DCC) and Supporting Programmed Activity (SPA) for the 445 consultant neurologists surveyed in the ABN survey was 3419. If this is extrapolated to the 958 consultants, that would equate to 721 FTEs ie 1 per 91,175 (1.1 per 100,000). If all the PAs in the ABN survey were considered together ie including university and others then this would equate to 875 FTEs, which is equivalent to the RCP estimate of 873. The similarity between the 2 surveys adds validity to the data but as one of the aims of the ABN survey was to identify FTEs involved in patient care (ie DCC and SPA), the figure of 1 per 91,175 (1.1 per 100,000) is the most accurate reflection of consultant neurology numbers involved in patient care and thus for workforce planning future needs.
To put this in context, in 2004, according to WHO2 high, high middle, low middle, low income countries, the number of neurologists per 100,000 population was 2.96, 3.10, 0.74 and 0.03 respectively. This is despite the UK having a relatively good density of medical doctors per 10,000 of the population at 28 (WHO 20193) where the equivalent numbers for high, high middle, low middle, low income countries are >30, 10-30, 2-10, <2 respectively. A recent survey in 2019 by the European Academy of Neurology5 (EAN) estimated the number of neurologists per population in the UK to be 1 per 39,059 (mean across Europe 1 per 15,799). The discrepancy in results is due to the European study including trainees and not including the impact of less than full time working. The similarity of the RCP and the ABN data suggests the ABN figure of 1 per 91,175 for FTEs is more accurate but even using the EAN number the UK was ranked 44 out of 45 European countries for number of neurologists per population with only Ireland being worse.
The number and type of Programmed Activities (PAs) for consultants was analysed and showed that neurologists were similar to physicians as a whole when considering those whose primary contract was with the NHS (79%). However, unsurprisingly those with their primary contract with a university (17%) had different job plans (Table 2).
Geographical spread of workforce
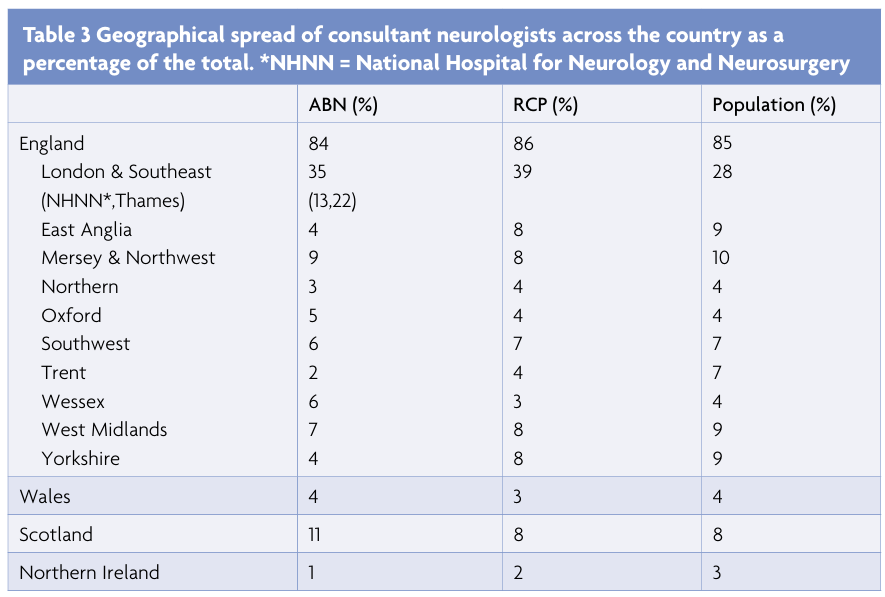
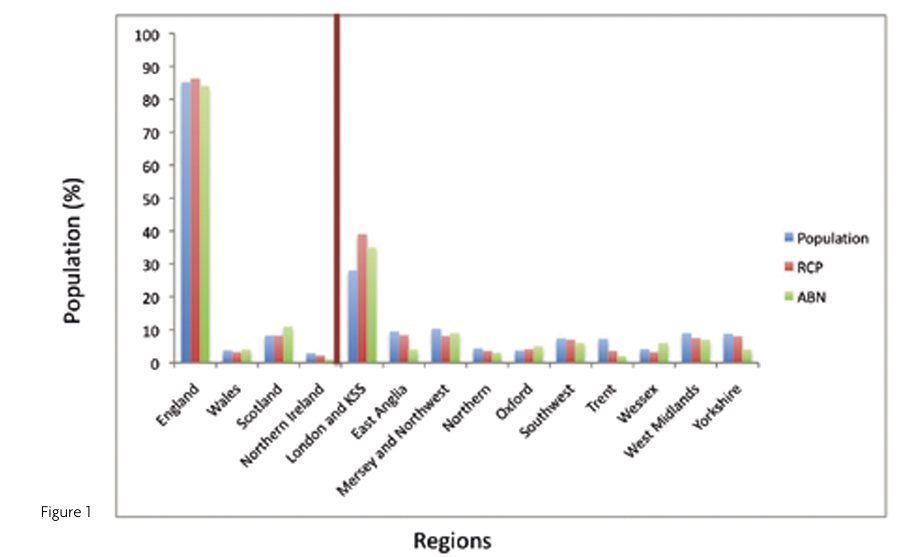
The geographical spread across the country compared to the spread of the population is outlined in Table 3/Figure 1. Although the proportion of consultants currently based in London and the South East was greatest, the number of consultant neurologists in this region remains well below the numbers in other high income countries.
Gender
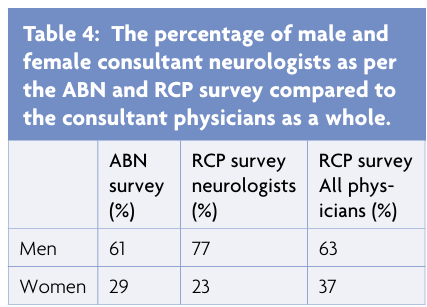
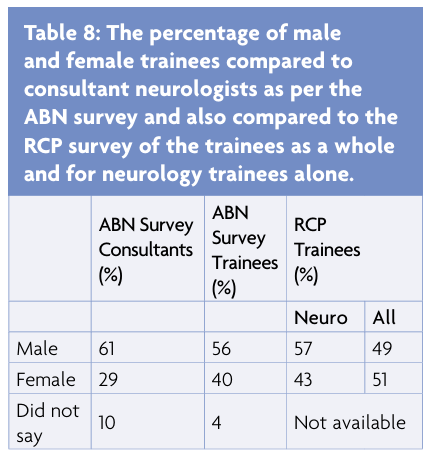
The RCP survey calculated the percentage ratio of men to women as 77:23 ie less gender balanced compared to the physicians as a whole (Table 4). The ABN survey found that the balance was better (10% did not answer the question) but still not on par with physicians as a whole.
Ethnicity
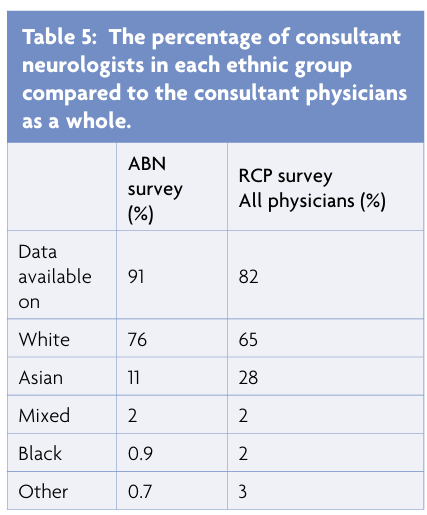
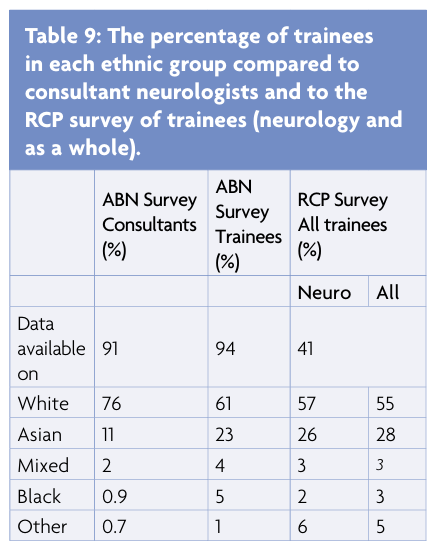
The ethnic profile of consultant neurologists is currently different to that of the consultants as a whole with fewer from ethnic minorities (Table 5).
Country of Graduation
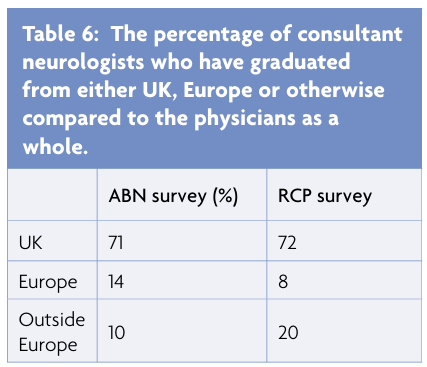
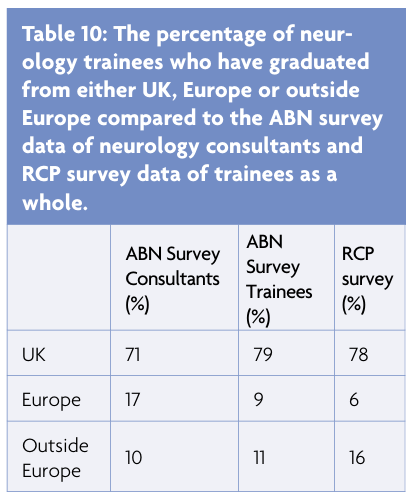
The proportion of neurologists from Europe and outside Europe is reversed compared to physicians as a whole (Table 6). Most consultant neurologists who trained outside the UK trained in Europe rather than outside Europe.
Less than full time working
27% of consultant neurologists reported that they worked less than full time (LTFT). 56 (47%) were women; 49 (42%) were men and 13 (11%) did not specify their sex. 8/118 consultants stated that they were part time but their PAs totalled greater than 10 and 33/327 consultants stated that they were full time but their PAs totalled less than 10. As per the RCP census, this was not taken into account and the data were analysed based on self-reporting. The equivalent for RCP census was 23% of all physicians reported that they worked LTFT.
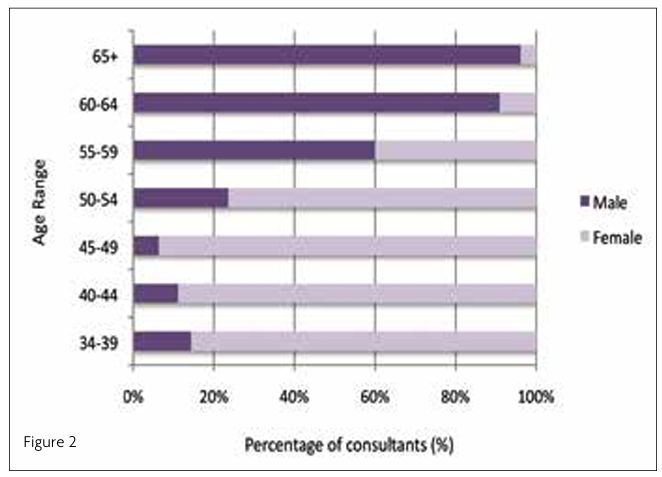
The reason for this varied depending on gender – 84% of women worked LTFT for family commitments and 65% of men worked LTFT due to partial retirement. The percentage of male consultants increased with age (Figure 2) so most male consultants working LTFT were older.
Clinical work performed
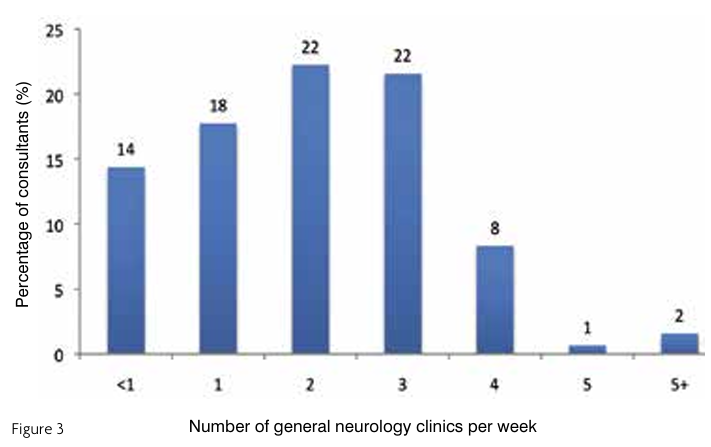
84% of the consultants reported that they practiced general neurology. There was a spread in the number of general neurology clinics run per week with an average of 2.3 (standard deviation 1) – see Figure 3.
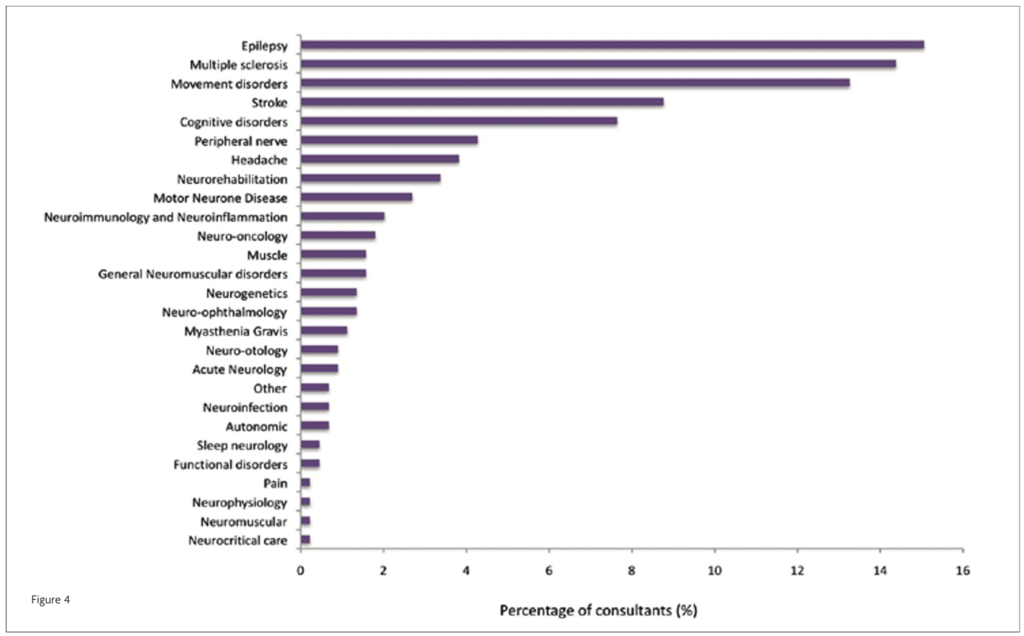
The top three sub-speciality clinics run by consultant neurologists were epilepsy, multiple sclerosis (MS) and movement disorders with 15%, 14% and 13% of consultants reporting these three as their main subspecialist interest (Figure 4). The prevalence of these three conditions is epilepsy 4 per 1000 and both MS and Parkinson’s are 2 per 1000. Taking prevalence into account, there should be double the number of consultants for epilepsy compared to MS and Parkinson’s. The prevalence of stroke is 14 per 1000 but the finding that stroke is not within the top three is probably explained by other medical specialities being involved in stroke care. However Shape of Training changes with consultant neurologists being more involved in acute neurology and stroke may impact on this in the future. Figure 4 illustrates the spread of sub-specialities covered by neurologists.
Retire and Return
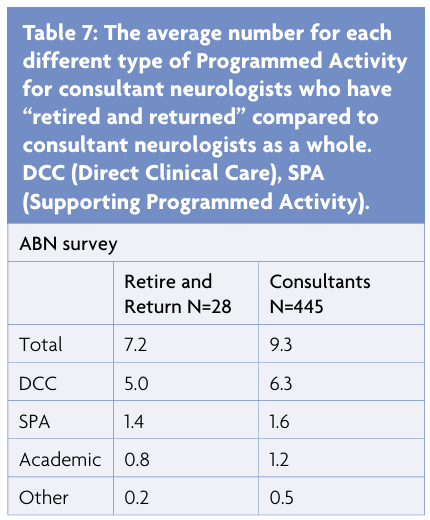
6.3% of consultant neurologists reported that they were in a “retire and return” post. This is in comparison to the 4.9% of all consultant physicians reported in the RCP survey.
The distribution of work performed by this group of consultants is shown in Table 7 as compared to the consultant neurologist group as a whole.
Neurology Trainees
This section presents the trainee data. As mentioned above, for this analysis, those respondents who self reported themselves as either a specialist registrar (93) or a research fellow (35) are considered as a trainee.
Gender
Although the trend is shifting towards gender equality, this has not reached the level of medical trainees as a whole with a higher proportion of neurology trainees being male (Table 8).
Ethnicity
As with gender, the shift in the ethnicity of the neurology trainees is moving towards the ethnic distribution seen for trainees as a whole (Table 9).
Country of Graduation
This is similar to RCP trainees as a whole (Table 10).
Less than full time working
Fewer trainees work less than full time compared to consultants. This needs to be taken into account in workforce planning as the number of consultants who work LTFT is over double (27%) the number of trainees (12%) who do so (Table 2). Compared to trainees as a whole, more male neurology trainees work LTFT. 75% of female LTFT trainees cited family commitments as the reason for working LTFT whilst 17% of male LTFT trainees gave that reason with 83% of the men stating “other – not specified”.
Discussion
The key findings of this survey conducted by the ABN are:
- For consultant neurologists involved in patient care (DCC and SPA PAs), the number of FTEs is 1 per 91,175 (1.1 per 100,000) and not 1 per 75,292 as calculated by the Royal College of Physicians. This is much less than expected for similar high income European countries5 (eg. France and Germany both have 1 per less than 25,000). This inevitably has an impact on quality of care provided for patients with a neurological condition especially with regards to equitable and timely access to a consultant neurology opinion throughout the UK.
- As per the RCP data, there is significant geographical variation in the number of consultants throughout the UK.
- There is a gradual shift when comparing the trainee and consultant data towards better gender and ethnic representation in the former.
- There is concern for future workforce planning in that the number of female trainees is increasing but of the 27% of consultants that work part time 47% are female and work part time mainly due to family commitments. In contrast the 42% of male consultants that work part time generally do so at the latter stage of their careers due to partial retirement. If the increasing number of female trainees continue to work part time at the same rate as the current female consultants do then this will have an impact on consultant neurologist numbers in the immediate future.
- The type and number of sub-specialist clinics offered by consultant neurologists is appropriately centred around the three most prevalent neurological conditions (epilepsy, multiple sclerosis and Parkinsons disease) with the exception of stroke which may be explained by stroke care being traditionally shared by multiple medical specialities.
The ABN survey has provided valuable and accurate data on the number of consultant neurologists involved in patient care, the gender and ethnic breakdown of the consultant body and for the first time the breakdown of general neurology and sub speciality practise. Similar data is provided for neurology trainees.
The key limitation of this survey is the assumption that the respondents to the survey are representative of the consultant neurologist / trainee population.
Whilst it is reassuring to see the shift among neurology trainees towards a more representative gender and ethnic mix, there are worrying findings highlighted by this survey. The fact that the number of neurologists involved in patient care is much less than comparative European countries5 is particularly worrying at a time when there is a marked and welcome increase in therapies for neurological conditions which often need specialist administration and monitoring (eg. immunotherapies for multiple sclerosis, thrombectomy for stroke and the advent of novel genetic therapies for inherited neurological diseases). Although there is geographical variation in the number of neurologists in the UK with particular recruitment difficulties in certain parts of the UK that need addressing, the total number of consultant neurologists in the UK is too low and workforce planning needs to focus on increasing this number. This is particularly important as neurologists are increasingly and appropriately involved in stroke care and the plan for neurology training in the new Shape of training curriculum is for all future neurologists to be dually trained in neurology and stroke medicine for the benefit of the patients.
Another urgent concern is the dual impact of LTFT working doubling as trainees move to consultant posts and the 6% of neurologists who have retired and returned. We appreciate there are too few doctors across all specialities in the UK4 and that various long term solutions are being discussed to address this. There is an urgent need to immediately address the needs of young parents to make it easier to work more if they choose to do so. Making it more attractive for consultants not to either retire early or retire and return but to stay full time longer could also be made feasible immediately by removing the financial penalties of continuing to work full time. This is an issue which affects all specialities and is under active discussion which hopefully will lead to a speedy resolution.
We would like to thank all who contributed to this survey. Having accurate information is the first step towards recognising problems and working towards solutions.
References
- Royal College of Physicians. Focus on physicians: 2018-2019 census (UK consultants and higher specialty trainees). Accessed December 2019
- WHO & WFN. Atlas Country Resources for Neurological Disorders. 2004
- Global Health Observatory data, WHO 2019. Accessed November 2019. WHO & WFN. Atlas Country Resources for Neurological Disorders. 2004
- Goddard A. Double or Quits: calculating how many more medical students we need, Royal College of Physicians June 2018
- Günther Deuschl, Ettore Beghi, Timea Varga. The burden of neurological diseases on Europe: country profile of the UK. European Academy of Neurology. 24.6.2019.

